Measuring Population Density, Distribution and Patterns of
Survivorship
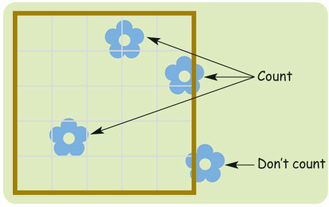
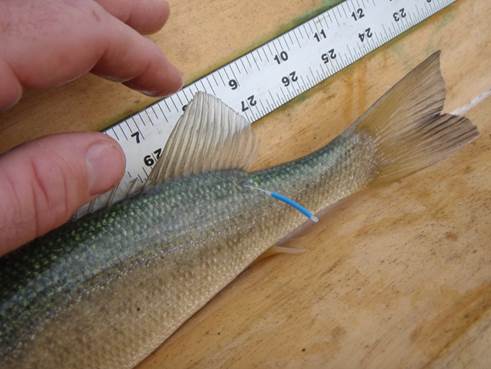
Population density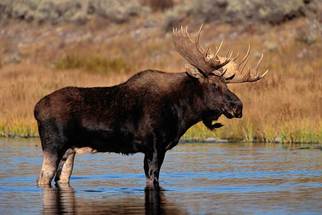
|
Calculate the crude density of a population of moose if 480 moose were counted in a 600 ha park? Density (D) = Number of Individuals (N) / Unit Area (S) 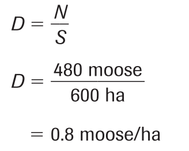
|
Measuring Populations
|
|
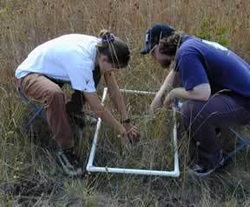
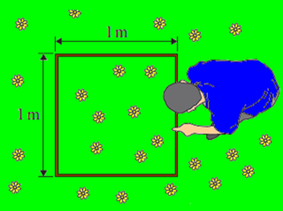
Try estimating populations with your class!
Lab activity –
record the number of individuals of your chosen plant species. Multiply densityb y total size of area for total population size. Link to protocol.
For winter semester - Worksheet Download
Lab activity –
record the number of individuals of your chosen plant species. Multiply densityb y total size of area for total population size. Link to protocol.
For winter semester - Worksheet Download
Population Dispersion Patterns
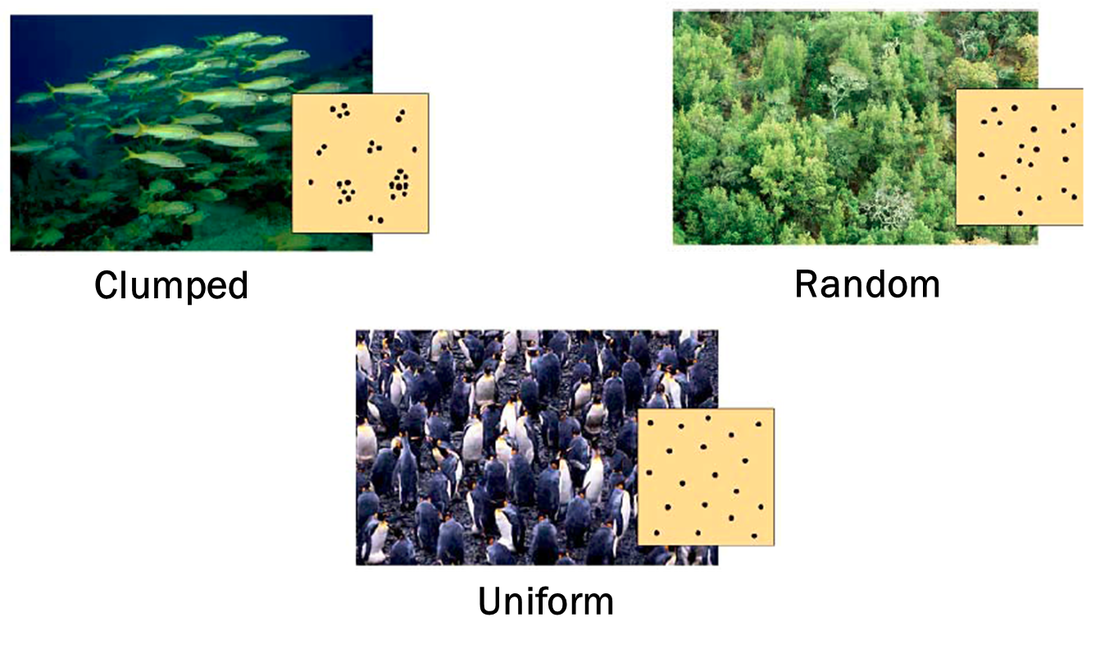
Populations typically display these three types of diepersal patterns. Groups of organisms within a single population can have varying dispersion patterns depending on environmental conditions and the presence of suitable niches (see fundamental niche).
Mark and Recapture Method of measuring population density
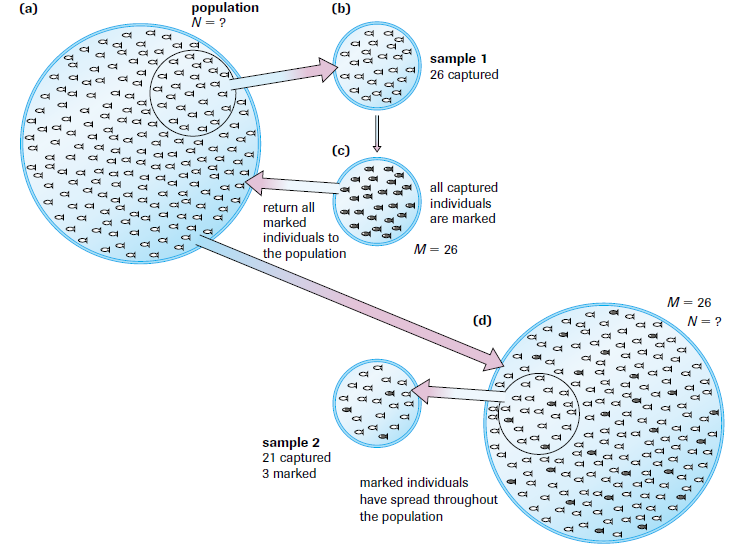
When working with very large populations that cannot be measured using simple quadrats, the mark and recapture method can be used to obtain estimates of population size. In the mark and recapture method a sub sample of the population is caught, marked in some way, and released back to the entire native population. A second sub sample of the population is taken and a population estimate is determined based on the number of marked individuals in the second sub sample. See equation below.
|
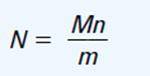
N = population size
M = Total Marked individuals m = marked individuals in second sample n = Total size od second sample |
Accuracy of the mark and recapture method depends on 3 assumptions:
1- The chance of each individual being caught is equal
2- The proportion of unmarked and marked remains constant
3- Population size does not increase or decrease
1- The chance of each individual being caught is equal
2- The proportion of unmarked and marked remains constant
3- Population size does not increase or decrease
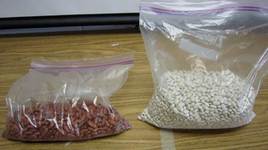
Try the mark and recapture method with your class!
Lab activity –
Use beans to simulate the mark and recapture method for estimating population density. Link to Protocol.
Lab activity –
Use beans to simulate the mark and recapture method for estimating population density. Link to Protocol.
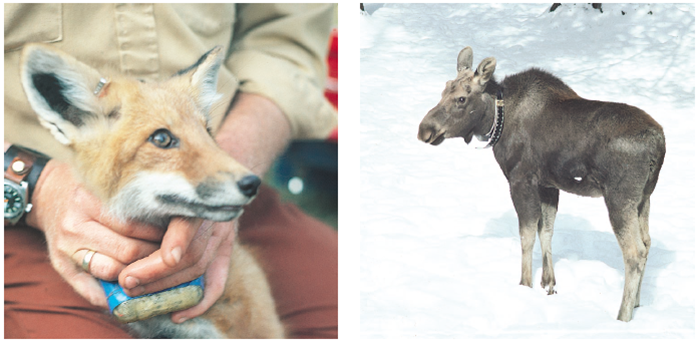
Tracking Wild Populations with Radio Collars
Radio collars and other satelite based tracking devices can be used to track animals and gather information on migration and population dispersion patterns. Collars should not harm the animals or restrict their activity. Maps of the animals true geographic range can be created using geographic information systems (GIS).
Use real time data to track animals!
Lab activity –
Students can track conduct actual research (mapping) on movement of different species of marine animals Research can be submitted for publication
http://whale.wheelock.edu/whalenet-stuff/stop_cover.html
Lab activity –
Students can track conduct actual research (mapping) on movement of different species of marine animals Research can be submitted for publication
http://whale.wheelock.edu/whalenet-stuff/stop_cover.html
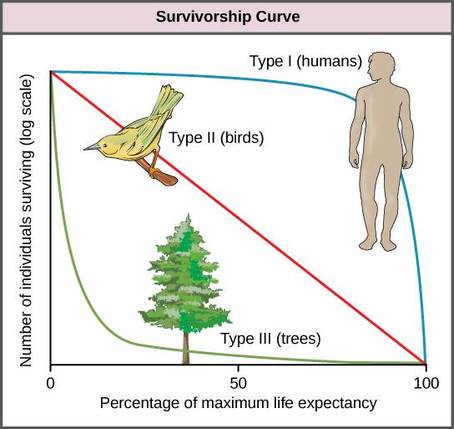
Patterns of Survivorship
There are three main survivorship patterns that biologist use to represent survivorship among individuals of a population.
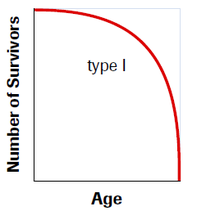
Type 1: have low mortality rates and live beyond their reproductive years. Have long life expectancy. Humans are an example of type 1 survivorship.
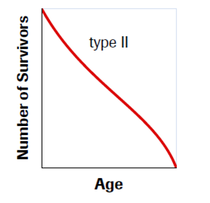
Type 2: mortality of individual does not depend on age. Constant proportion of individuals dying over time. Birds and rodents are examples of type 2 survivorship.
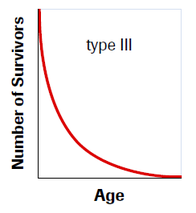
Type 3: high mortality when young while individuals that reach sexual maturity have a greatly reduced mortality rate. Beatles (insects) that lay millions of eggs with few survivors or a tree producing hundreds of seeds with only one seed sprouting are examples of type 3 survivorship.
Survivorship Curves with Examples